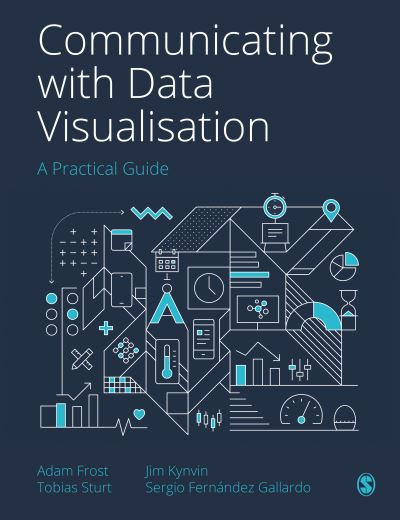
In Stock
Communicating with data visualisation
Paperback
€73.94
Collect 221 Reward Points
- Free Delivery from
- This Book Is Available Online Only
- Book Synopsis
- How can you transform a spreadsheet of numbers into a clear, compelling story that your audience will want to pass on? This book is a step-by-step guide (honed through the authors′ Guardian masterclasses, workshops and seminars) to bringing data to life through visualisations, from static charts and maps to interactive infographics and motion graphics. Introducing a four-step framework to creating engaging and innovative visualisations, it helps you to: · Find the human stories in your datasets · Design a visual story that will resonate with your audience · Make a clear, persuasive visual that represents your data truthfully · Refine your work to ensure your visual expresses your story in the best possible way. This book also includes a portfolio of best-practice examples and annotated templates to help you choose the right visual for the right audience, and repurpose your work for different contexts.
- About The Author
- Adam Frost has taught the Guardian′s data visualisation masterclass for the last 10 years. He has created infographics for the Guardian, the New Statesman, the BFI and a range of corporate clients. He has also written a series of award-winning infographic factbooks for children. He is currently Content Director at Add Two Digital.
- Product Details
-
- ISBN
- 9781529743777
- Format
- Paperback
- Publisher
- Sage, (02 December 2021)
- Number of Pages
- 352
- Weight
- 736 grams
- Language
- English
- Dimensions
- 246 x 189 x 24 mm
- Categories: